Core Web Vitals not passed: Identify and resolve CLS issues
For nearly three months, we struggled with CLS issues on our portal TutKit.com. We spent a lot of time and energy identifying and solving the problems with the Cumulative Layout Shifts. In this experience report, I would like to give you an insight into how we approached it.
Introduction: Why CLS is a Problem
The Cumulative Layout Shift (CLS) is one of the three core metrics of Google’s Core Web Vitals. These metrics are crucial for assessing the user-friendliness of websites and affect their ranking in search results. CLS measures the visual stability of a page and indicates how often unexpected layout shifts occur while a page is loading.
What does CLS specifically mean?
When elements on a website suddenly change their position during loading, it can be frustrating for users. You may know the experience when website content jumps because an advertisement pops up unexpectedly. A button that is about to be clicked can suddenly change its position and activate a different link instead. Such unexpected layout shifts are disruptive and negatively impact the user experience.
The CLS value is calculated based on the size of the shifted element and the distance it travels within the viewport. Google considers CLS values below 0.1 to be good, between 0.1 and 0.25 as needing improvement, and anything above that as poor.
Here is the chart from our Search Console. Yellow represents the values between 0.1 and 0.25, and red indicates the pages that have values beyond that.

The classic causes of high CLS values for most websites are oversized images in outdated image formats (JPG/PNG) and/or without fixed dimensions. When images do not have defined height and width specifications, they can cause layout shifts. This happens because the browser reserves space based on the image’s aspect ratio (width/height) while the image is loading. Or dynamic content like ads, pop-ups, or embedded content that appears later during the loading process causes a cumulative layout shift. The slow rendering of fonts can also affect the layout when a system font is loaded first and later replaced by a web font. This can cause text to shift, for example, increasing a paragraph from six to seven lines and pushing the subsequent content downwards. Since each font has its own character size, a change in font can lead to line breaks and unexpected layout changes.
Although we had excellent PageSpeed scores at TutKit.com, we simply did not meet the Core Web Vitals for most pages since mid-December 2024. It looked just crazy: mobile PageSpeed score of 95 or 97, but Core Web Vitals not passed. The problem was CLS. Since CLS takes into account not only the first viewport but also interactions within the page, identifying the cause was difficult. In this report, we share our experiences with you on how we identified and successfully resolved the issues.
Cause analysis: Why did CLS occur in our case?
In the past few weeks, some SEO experts I follow on LinkedIn reported sudden CLS warnings that have appeared in Google Search Console since December 2024 and January 2025. This could be related to the December 2024 Core Update that Google implemented in mid-December. Websites that previously had green CLS values were suddenly classified as problematic, including ours.
One possible reason is an adjustment to Google’s evaluation system for user signals. There are indications that interactions within the pages play a greater role in the ratings. As a result, Core Web Vitals scores can deteriorate even without technical changes. What was previously acceptable is now causing issues. And for us, due to the variety of different page types, sections, and functions, there were a few more areas that caused the CLS problems:
- Google AdSense: Delayed loading of ads led to shifts.
- Table of contents: Dynamic loading via JavaScript caused layout jumps.
- Images without width/height specifications: Suddenly appearing images changed the structure of the page.
- Webfonts: Loading the fonts later led to unexpected breaks.
- FAQ module: Questions that are opened by default caused unpredictable layout shifts.
- Slider & Accordion Tabs: Content was rendered and moved afterwards.
- Google Reviews: Extern loaded content influenced the page structure.
These issues were not easy to identify, as lab tests like Lighthouse and PageSpeed Insights did not show any significant CLS values.
The difficult path to recognizing problems caused by hidden layout shifts
Why were CLS problems so difficult to identify?
- Lighthouse and PageSpeed Insights showed optimal values, as they measure only the first loading process and do not simulate real user scenarios. They test the site in a laboratory environment with stable networks and ideal loading conditions. As a result, many layout shifts that occur during real interactions are not detected.
- Google Search Console indicated CLS as a problem because it analyzes real user data (Field Data). This data comes from real users with different devices, networks, and usage patterns, highlighting issues that did not appear in lab tests.
- The CrUX API and BigQuery do not provide real-time data, but rather aggregated values from the last 28 days. This means that improvements become visible only with a delay, and immediate evaluation was not possible.
In the Search Console, the URL types with CLS issues were mentioned, which served as an initial good indication of the failure to meet the Core Web Vitals, even though the normal checks via PageSpeed Insights or Lighthouse did not show excessively high CLS values. We had to find our own method to make CLS errors visible to us.
Analyze with Chrome DevTools → Performance Tab
The entire website was reloaded section by section with each page type and analyzed for layout shifts. For this, we used the Performance tab in Chrome DevTools instead of Lighthouse or PageSpeed.
Particularly problematic elements were marked and tested repeatedly with various throttling settings. By artificially throttling the internet speed to slow 4G, we were able to better simulate delays in loading individual elements and track layout shifts. Here in the picture, we see a layout shift that became visible with network and CPU throttling:

We recorded all CLS issues and were able to identify the problematic components of the website. In our tests, we not only included the problematic page types according to Search Console, but all page types with all sections of the subpage to address the issue sustainably in case the requirements for website operators are further tightened in the future.
All simple and quick tests can be conducted using DevTools → Performance and by reloading the page with F5 at various positions, or through a harder and more intensive test with Performance Recording.
Some layout shifts are nearly impossible to notice during regular testing. For example, page type A may not include any layout shifts, and page type B may also exhibit no layout shifts. It is only when switching between both pages during forward and backward navigation that the CLS problem emerged, which could not be identified when examining the individual pages in isolation.
Therefore, always test complete user flows and not just isolated pages to identify hidden layout shifts. Analyzing actual user behavior often reveals errors that standardized tests overlook. This way, potential issues can be detected early, and performance can be kept stable.
Tests with different screen resolutions:
By default, Lighthouse and PageSpeed Insights test with a fixed screen size. In the Google Search Console, we found from the indication of problematic URL types that some CLS issues occurred only for certain user groups, such as visitors from Sweden using specific mobile devices.
We also conducted mobile tests with different resolutions to identify specific issues that arose in real usage scenarios. For this, we exported data from Google Analytics and performed tests for 200 different mobile resolutions to identify problems that were only visible at a certain resolution. To give an idea of the range of resolutions used by visitors on a website: the export file from Google Analytics showed 4,083 different resolutions for desktop, tablet, and mobile over a period of four weeks. We sorted these by the number of users. Even in 200th place among the resolutions, we still had 88 users who were using the resolution 412×778 during this four-week period.

Google has recently added a tool that allows you to adjust the throttling of your PC or notebook to various mobile devices.

This systematic approach helped us identify the exact problem areas and implement targeted fixes. It is important to understand that certain CLS issues arise only under specific conditions, but these can undermine the overall evaluation of the page.
Our solutions for the identified CLS issues
After identifying the causes of the layout shifts, we implemented targeted measures to address them.
Setting image dimensions
Problem: Images without defined width and height specifications led to unexpected layout changes.
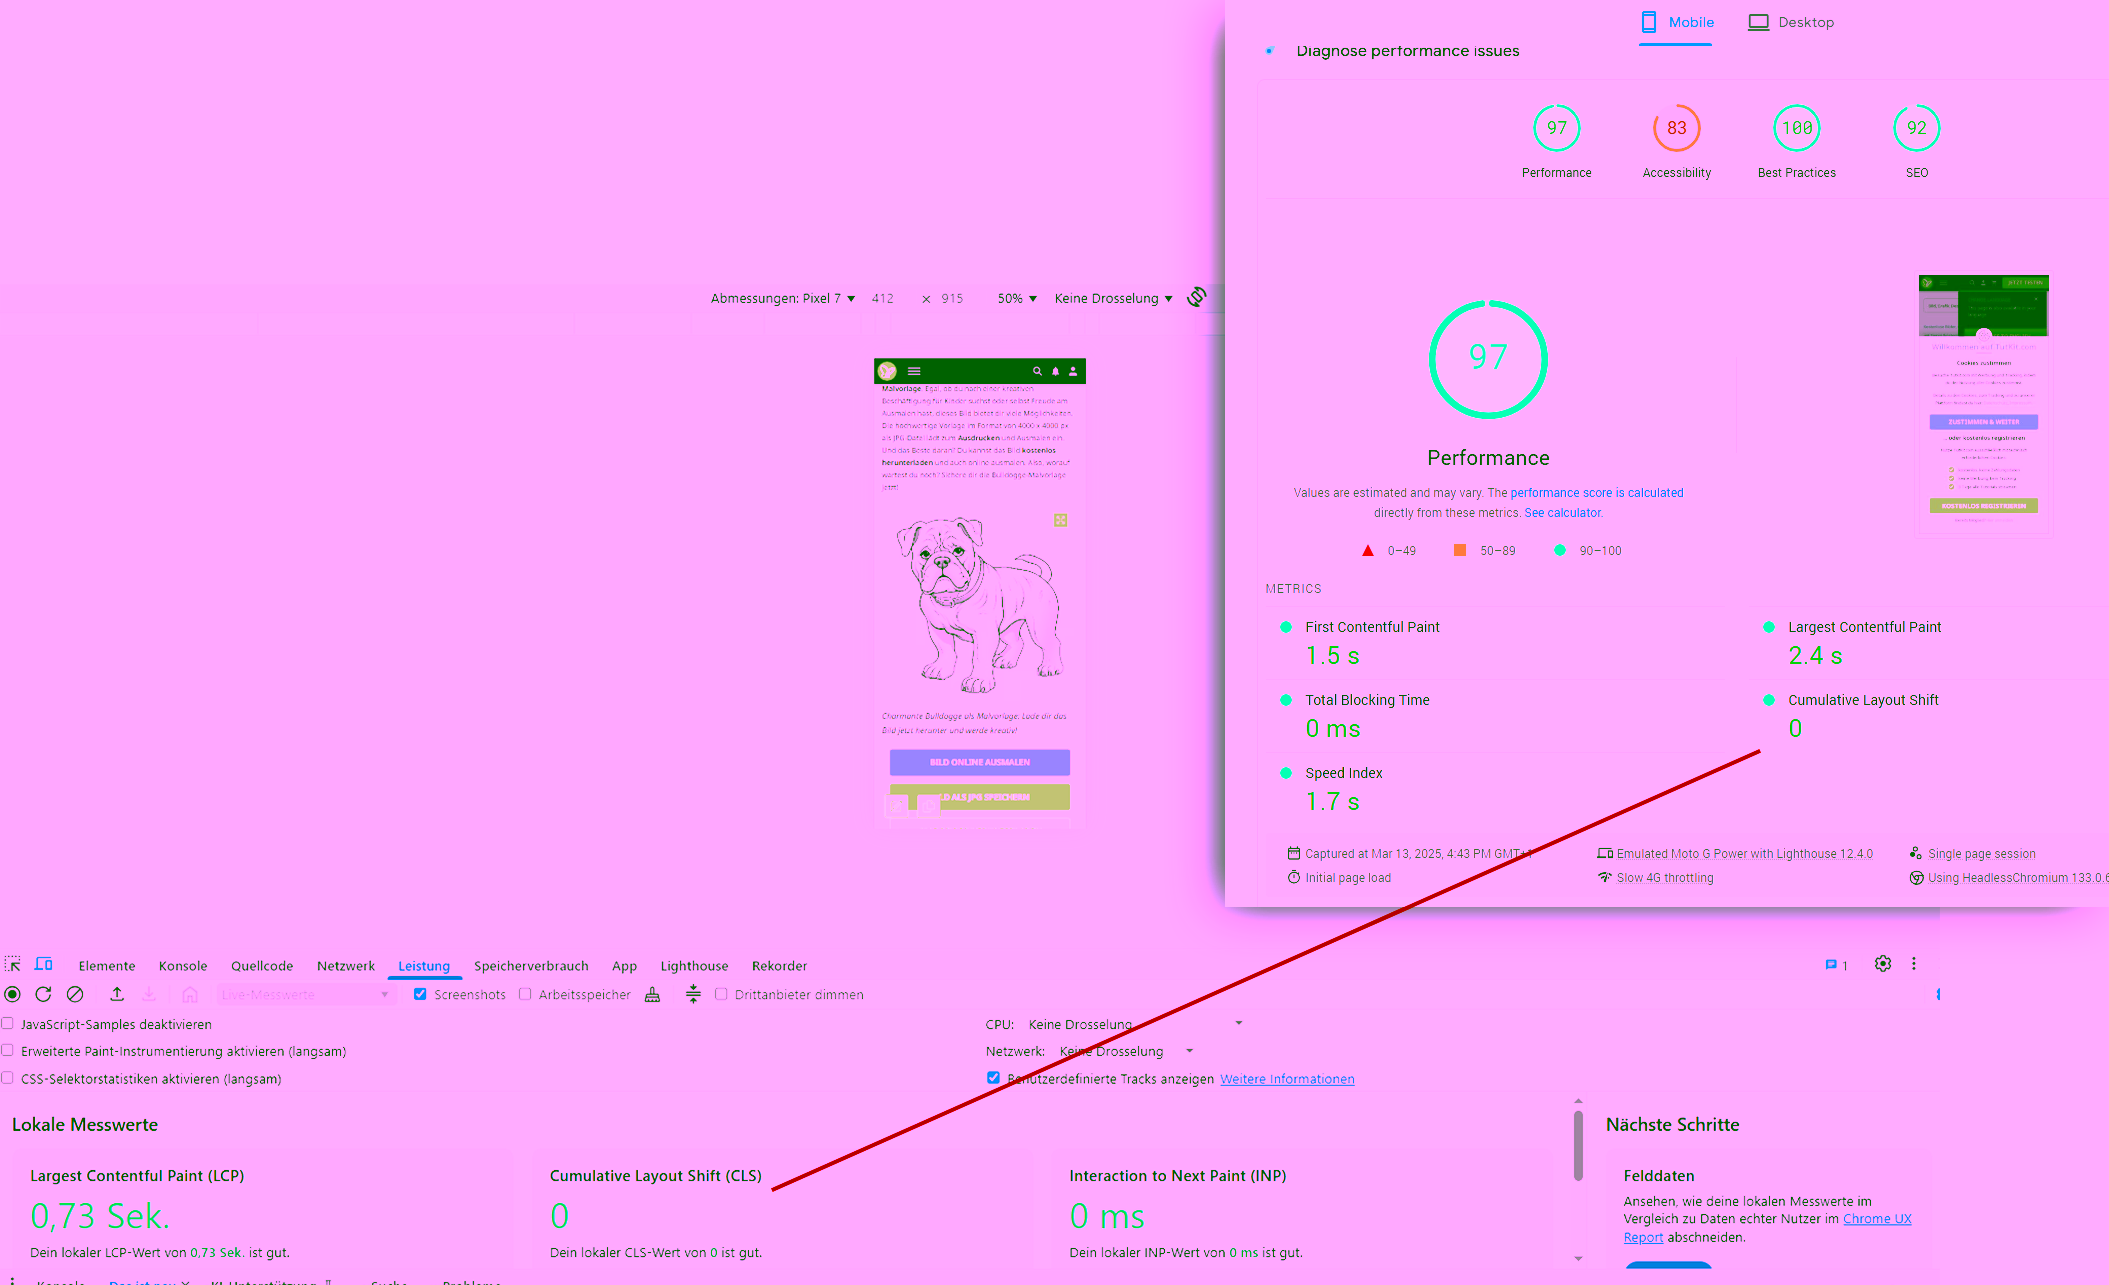
Here you can see, for example, the mobile PageSpeed score of 92 Performance without any noticeable CLS issues. With our tests in the DevTools under the Performance tab, we have now identified the problem in real user behavior. The CLS value was measured at 0.22… clearly too high.

Solution: A part of the images was still missing a width-height specification. We created a query for all images in the portal and automatically added this specification to the code. The frontend now knows the size of the image when loading and already reserves the necessary space in the layout that reflects the appropriate aspect ratio of the image. This way, there is no jump when loading the image. A nice side effect: the mobile PageSpeed score has also improved as a result.
Here is the same URL after the merge of our CLS fix in the identical test with PageSpeed Insights and the DevTools:
Optimization of web fonts
Problem: Late loading of fonts led to breaks and layout shifts. We specifically had the issue that the system’s default font (in this case: Arial) was loaded first, followed by the Noto font as a webfont. We use the Noto webfont in our portal. Google had the font designed to support all existing writing systems, from Latin characters to Cyrillic and Arabic scripts, as well as more exotic character sets like Khmer or Tamil. This makes this font ideal for a multilingual platform like TutKit.com, where content is provided for a variety of target audiences. One major advantage of Noto is its wide language support – however, this also posed a technical challenge. Since Noto covers so many writing systems, the font family is extremely extensive.
By default, often more characters are loaded than are actually needed. This can lead to longer loading times, especially for mobile users, which negatively affects user experience and SEO.
Solution: We checked which font weights from 100 to 900 were being loaded and matched that against the needs of the user interface, which allowed us to reduce the various font weights. On the other hand, the font files were reduced to only the actually necessary characters. Only two font files were loaded with a total size of 105 kB.

We also no longer use whole font files for the individual languages, but only subsets of the fonts. When opening our language switcher, new languages are loaded with special characters from the Nordic and Slavic languages; language sets are loaded for Greek, Cyrillic, Japanese, and Korean. The subsets are very small in file size with two exceptions.

This allowed us to reduce loading time and ensure that texts are displayed correctly from the beginning without a visible shift from system font to web font.
Further adjustments for CLS fixing
In addition, we also directly addressed the other CLS issues that we identified. These included, for example:
Google AdSense Optimization
Problem: Delayed loading of ads led to layout shifts. Solution: Adjustment of AdSense settings to use static placeholders that reserve the required space when the page is loaded.
Conversion of the table of contents from JavaScript to PHP.
Problem: Dynamic loading via JavaScript caused layout shifts. Solution: Render the table of contents in blog articles server-side with PHP to ensure they are available immediately upon page load and do not cause subsequent shifts.
Adjustment of the FAQ modules
Problem: Questions open by default caused unpredictable layout shifts. Solution: Removal of the feature that had questions open by default to avoid unexpected layout changes.
Optimization of slider and accordion elements
Problem: Content was rendered only afterwards, leading to layout shifts. Solution: Preloading the elements and setting fixed height specifications for sliders to ensure a stable layout during loading.
Improvement of the integration of Google Reviews
Problem: Extern loaded content affected the page structure and caused layout shifts. Solution: Use of lazy loading with fixed placeholders to ensure that the necessary space is already reserved when the page is loaded.
Since I did not document individual images for each fix, here is an excerpt from JIRA, our project management tool, in which the tasks with CLS references are filtered and displayed.

Initially, we created a ticket for each irregularity and triggered the validation in the Search Console after the merge. However, this was not enough, as on one hand the validation failed and on the other hand, further issues were identified in the next step, so we ultimately consolidated the CLS problems into three tickets (List of CLS problems) until they were all fixed. There were indeed more problems than expected. The number of tickets and the range of ticket numbers clearly indicate how long and intensely we dealt with the CLS issues. While the news portal Heise was able to resolve their CLS issues—caused by the consent cookie banner—with a single line of code, we had to work on a few more lines of code.
After implementing the last measures, we noticed that the improvements were not immediately visible in the Google Search Console. The validation process was indicated to take up to 28 days. This is because the Search Console is based on real user data that is aggregated over a period of 28 days. Therefore, it can take up to four weeks for the effects of the changes to be fully reflected. In our case, initial improvements were visible after nine days.
Have you completed your homework?
One of the SEO experts who reported on his CLS issues on LinkedIn expressed his appreciation to all teams that meet the Core Web Vitals in their projects: I admire all the teams that meet the Core Web Vitals! Because I can’t manage it myself…
The recognition is justified, as meeting the Core Web Vitals for large websites requires a strong focus on technology, PageSpeed, and user experience. While I report here how we solved the CLS issues on our site, the sheer number of identified problems might give the impression that we already had some technical aspects in disarray. But that’s absolutely not the case. With the rollout of our multilingual capabilities, we faced many new challenges and thus spent several months on CSS and JS refactoring, reducing database queries, and other PageSpeed improvements such as TTFB optimization. Today, PageSpeed Insights shows a mobile PageSpeed score of 95 for our homepage. There are only a few recommendations in the report that indicate further improvement potentials.

Here is a subpage that recently also had CLS issues. Take a look at the few recommendations that PageSpeed Insights gives us. The second point regarding the image elements doesn’t even concern the main image of the page, but two arrows that function as navigation elements. (Good thing I wrote this post. Now I’ve directly created a ticket, so we can also provide the information for this, so that the frontend knows even faster what size is intended for it.)

Despite this already clean foundation from TutKit.com, CLS issues have arisen. And our luck was that we had mostly completed our homework for the PageSpeed optimization standards in 2024. The situation looks different for the SEO expert from LinkedIn, who honestly admitted his own problems with the Core Web Vitals. I checked his website. Just the font files that are loaded when accessing the page are immense. Compared to TutKit.com, a multiple of files and sizes are loaded here, even though the homepage is smaller compared to ours. See here:

In fact, we have found that PageSpeed and CLS issues often go hand in hand with a suboptimal font policy.
When the page is tested on PageSpeed Insights, the values are disastrous. Google’s recommendations are correspondingly lengthy (in the image on the right):

From a technical performance perspective, there are indeed several issues with this website. In the tests I conducted randomly based on our inspection system, there were CLS problems in several areas of the subpages. Additionally, a banner popped up that caused an extra layout shift.
Even if developers focus on CLS issues in isolation, they cannot avoid implementing modern website standards here as well, meaning they need to address font issues, use modern image formats like Avif, refactor CSS and JS files, consistently load lower images with Lazy Loading, etc. Because without these fundamental performance optimizations, a quick CLS fix will not be sufficient or sustainable.
How many recommendations are you still receiving from PageSpeed Insights? Have you already completed your homework?
Excursion: PageSpeed 100 and still not passing Core Web Vitals
Everyone in Germany knows the Career Bible with good tips on applications and working life. Last year, a relaunch took place there, which, in my opinion, also aimed to make technical optimizations. And indeed, I find outstanding values in terms of PageSpeed: The homepage scores 99 for mobile and 100 for desktop. Respect.

From a design perspective, however, I still can’t warm up to the house font: Arial. It’s really not good. It directly reminds me of official correspondence. But Karrierebibel has a technical advantage because of this. No font files are loaded at all. The website simply specifies in the source code that the font is Arial. Since it is pre-installed on every system in Germany anyway, the website does not waste time loading font files. This way, the website directly avoids one of the causes of PageSpeed problems: loading fonts.
However, PageSpeed and CLS should always be viewed holistically, which is why it is important to systematically consider the different resolutions as well. The CrUX board for desktop shows a lot of CLS issues in desktop views.

When I test a subpage with PageSpeed Insights, I get a PageSpeed of 100 for desktop, but the Core Web Vitals do not pass. This is also possible, as you can see in this example.

Therefore, use various testing tools to find the errors that are currently causing you to miss important metrics. Because failing the Core Web Vitals also means missing an important ranking signal for Google. There may be a connection when certain ranking signals and measurement metrics are not met and the decline in online visibility on Google occurs. Here in the image, it can be seen how visibility has decreased from over 64 to the 30s within a year. While the reasons are certainly not solely found in the Core Web Vitals. But it is always better to have done your homework thoroughly. We cannot influence the external framework conditions. What happens on your own website, however, can be controlled.

Conclusion: Our findings
It is possible to consider CLS in isolation if optimizations for high PageSpeed have already been made beforehand. However, the impact remains significant if the Core Web Vitals are not met due to CLS issues.
The impact that failing the Core Web Vitals can have becomes clear when we look at the following correlation. In the CrUX board for our portal, it is evident that since October 2024, increasing issues with CLS have accumulated for mobile usage. The image shows the CLS values solely for phone devices.
Here is the breakdown by phone, desktop, and tablet, showing how the usage on TutKit.com is divided:

It is not the case that we gained more desktop users. No, we simply lost a portion of our mobile users. Daily, it amounted to five-digit clicks. To be honest, that really hurts. Now we have finally solved the CWV problems, and the Search Console shows exclusively good metrics for the URLs:

Therefore, we are very curious to see whether the clicks will recover now and if we can record an increase in mobile uses in the Search Console. I will publish an update to this post in a few months.
The recent changes show that CLS optimization remains a challenging task. Our key learnings are:
- Consider CLS problems early in the development process.
- Labor data is not enough – real user data is critical.
- CLS has a huge impact on the Core Web Vitals as a ranking signal and thus on visibility in Google.
In the long term, a systematic approach helps to sustainably minimize CLS issues and ensure an optimal user experience, as this is also part of SEO.
If you have problems with CLS in particular or performance in general, feel free to contact us. We have developed a deep understanding of it and can certainly assist you.