Improve TTFB: How we were able to reduce our server’s initial response time by 88 percent through route caching.
Every millisecond counts when building a website. The speed at which a website responds has a direct impact on user experience and search engine optimization (SEO). As an agency specializing in fast and efficient websites, we are always looking for optimization opportunities to enhance the performance of our projects. A crucial factor for a website’s speed is the server response time, which measures how quickly a server starts sending data to the browser. In this post, I want to show you how we were able to drastically improve the server response time and thus the TTFB value through the optimization of route caching on our website TutKit.com.
Here is a comparison of the values using the Audisto tech SEO tool before and after the implementation of route caching – a decrease of 88 percent in response time:
")
Before you say to yourself: wow, we are celebrating these speed improvements here with the activation of the cache. This is not about the classic database cache! Just to explain the difference. The route cache discussed here reduces the processing time for routing logic, allowing the server to respond to requests more quickly. The database cache stores the results of database queries, reducing the number of direct database accesses and optimizing loading times. The database cache was already running with us before, of course.
Server response time vs. TTFB (Time to First Byte)
First, an explanation of how Server Response Time and TTFB are related, as both terms will be used repeatedly in the following text. The server’s first response time is a part of TTFB, but it only refers to the time the server takes to process a request and send the first response. TTFB is a more comprehensive metric that also includes additional measures of network delays (DNS, connection, data transmission) before the first byte of the response arrives at the browser.
The server initial reaction time (also referred to as server response time) measures the time it takes for the server to receive, process, and send the first response to a request. This time includes:
- The moment the server receives the request.
- The processing time on the server (e.g., loading data, rendering templates, executing logic).
- The sending of the first response (often the HTTP headers or the first part of the HTML page).
- The server initial response time is therefore an important factor for the performance of a website, as it determines how quickly the server starts sending the response.
TTFB is a more specific metric that measures the time it takes for the first byte of the server’s response to reach the client (browser). This time starts as soon as the request is sent by the browser and ends when the first byte of the response arrives at the client. TTFB consists of several components:
- DNS lookup: The time it takes for the browser to find the server’s IP address.
- Connection establishment: The time required to establish a TCP connection and a secure connection (e.g., via TLS).
- Server response time: The time it takes for the server to process the request and send the response.
- Data transfer: The time required to transmit the first byte of the response from the server to the client.
If your server is very fast but the network connection is slow or the DNS query takes a long time, your server’s initial response time may be good, but the TTFB still shows poor values. If the DNS query and the connection setup are fast, but the server responds slowly to requests, both the server’s initial response time and the TTFB will be poor.
TTFB is therefore a more comprehensive metric than server response time, as it includes not only the processing on the server but also the network transport of the response to the client.
Starting point: Improvement potential in server first response time
Our team analyzed a variety of pages on our multilingual portal TutKit.com using tools like Google PageSpeed Insights. A notable point in the results was the server’s first response time in particular and the TTFB value in general. Before our optimization, the server response time fluctuated between 280 and 700 milliseconds – depending on the type of page – which in many cases led to a noticeable delay. These values are suboptimal for modern websites that require fast user interaction. We spent a lot of time on CSS & JavaScript refactorings to improve the PageSpeed values and also implemented further optimization suggestions from the PageSpeed Insights, such as using the modern image format AVIF. Nevertheless, the TTFB value remained low. Moreover, with each additional language we activated on our portal, the server’s first response times and the TTFB value worsened.
We started the rollout of the English and Russian languages in February 2024. Our previously good TTFB values plummeted.
")
In March, we started our major sprint for JavaScript refactoring, which will conclude in October. This JS sprint has included several milestones, allowing us to implement improvements online every few months, which have also had a very positive impact on website speed. There will be a whole article series about this JS refactoring sprint, as we have documented our refactoring work, and the document for the article series already spans over 100 pages. It is likely to be the most comprehensive documentation of a JS refactoring sprint available on the internet.
Here is a screenshot from our Miro board visualizing the individual steps of the JS refactoring sprint, which actually took place from March to October and was carried out by my Head of Development.
")
In April, a database sprint took place concurrently to reduce database queries, allowing us to decrease requests by up to 98 percent in some cases, which in turn made the pages load faster. The TTFB value further improved in April.
In May, we enabled additional languages, so at that time we were online with 16 language variants covering approximately 35,000 pages. The chart clearly shows how the improved April figures plummeted again.
In the following months, we continued to refactor the JavaScript files and optimized the DOM sizes, which benefited the PageSpeed. We also took care of some CSS improvements, particularly regarding font loading and the way icons are integrated (SVG sprites). In parallel, we enabled additional languages, so as of today we have 26 languages online across over 98,000 subpages. While all other core web vitals and PageSpeed relevant metrics were good, only TTFB had an issue. It was clear that there was something wrong with the DNS lookup, the server, and especially with caching.
The following screenshot is from the Core Web Vitals Checker by RumVision and shows the values before activating route caching. Everything looks great for TutKit.com except for the TTFB value.
")
After some checks and debugging sessions, we found that one of the causes of these delays was the inactive route caching. In Laravel, route caching is disabled by default. It needs to be activated manually to improve the performance of the application, especially in larger projects with many routes. When we were still a small project, it wasn’t an issue. The TTFB was positive, and the page was lightning fast. The normal database caching did its job well. It only became a problem for us when scaling the pages and languages.
The key to optimization: route caching
Route caching is a feature that allows a server to store all defined routes of a website in a cache, instead of recalculating them for every request. This significantly reduces the number of operations the server has to perform for each request, especially for larger websites with many pages and dynamic routes. We handle 500 to 800 URLs per route per language variant for each query.
In Laravel, the route cache is not automatically created even when routes are already in use. Instead, you have to manually create the route cache by running the command php artisan route:cache. This command compiles all routes into a single cache file to improve performance, especially in production. Using routes during normal website usage does not trigger route caching, as Laravel relies on this manual command to cache routes. Without executing this command, Laravel will continue to load routes directly from the route files with each request. We execute this command after every live deployment to ensure optimal performance.
Laravel, as a PHP framework, offers several caching options. Caching can occur through databases (the standard that many website operators know as server-side database caching) and through PHP. In the latter case, route caching comes into play, which is not enabled by default in PHP frameworks because it is often not necessary for most websites. Additionally, it is more or less a specialized caching option in Laravel.
Laravel offers many caching options that you need to enable and configure to take advantage of them. For the best results in a production environment, it is advisable to activate configuration, route, and view caching, along with a suitable database caching backend, depending on the needs of your application.
After we enabled route caching, we quickly realized that it did not function as expected. Through debugging, we found that changes were necessary in 12 different places in our code. In particular, the MapApiRoutes function had been loaded twice, which significantly impaired the efficiency of the route cache.
Debugging and Fix: After analyzing these duplicate charges and other issues in route management, we implemented the necessary fixes and successfully activated the route cache. This directly led to a noticeable improvement in how our website responds to requests.
Reduced Server First Response Time: After activating route caching and making the necessary corrections, we conducted tests with Google PageSpeed Insights again to measure the impact. The results were impressive: previously, the server first response time for different page types ranged from 280 to 700 ms. After optimization, the first response time dropped to 30 to 70 ms. Thus, we were able to reduce the server response time by about 88 to 90 percent.
This means that the website now responds much faster to requests, which is reflected not only in a better user experience but also in improved SEO performance. This reduction in server response time also improves TTFB values and is a massive gain in terms of speed and performance.
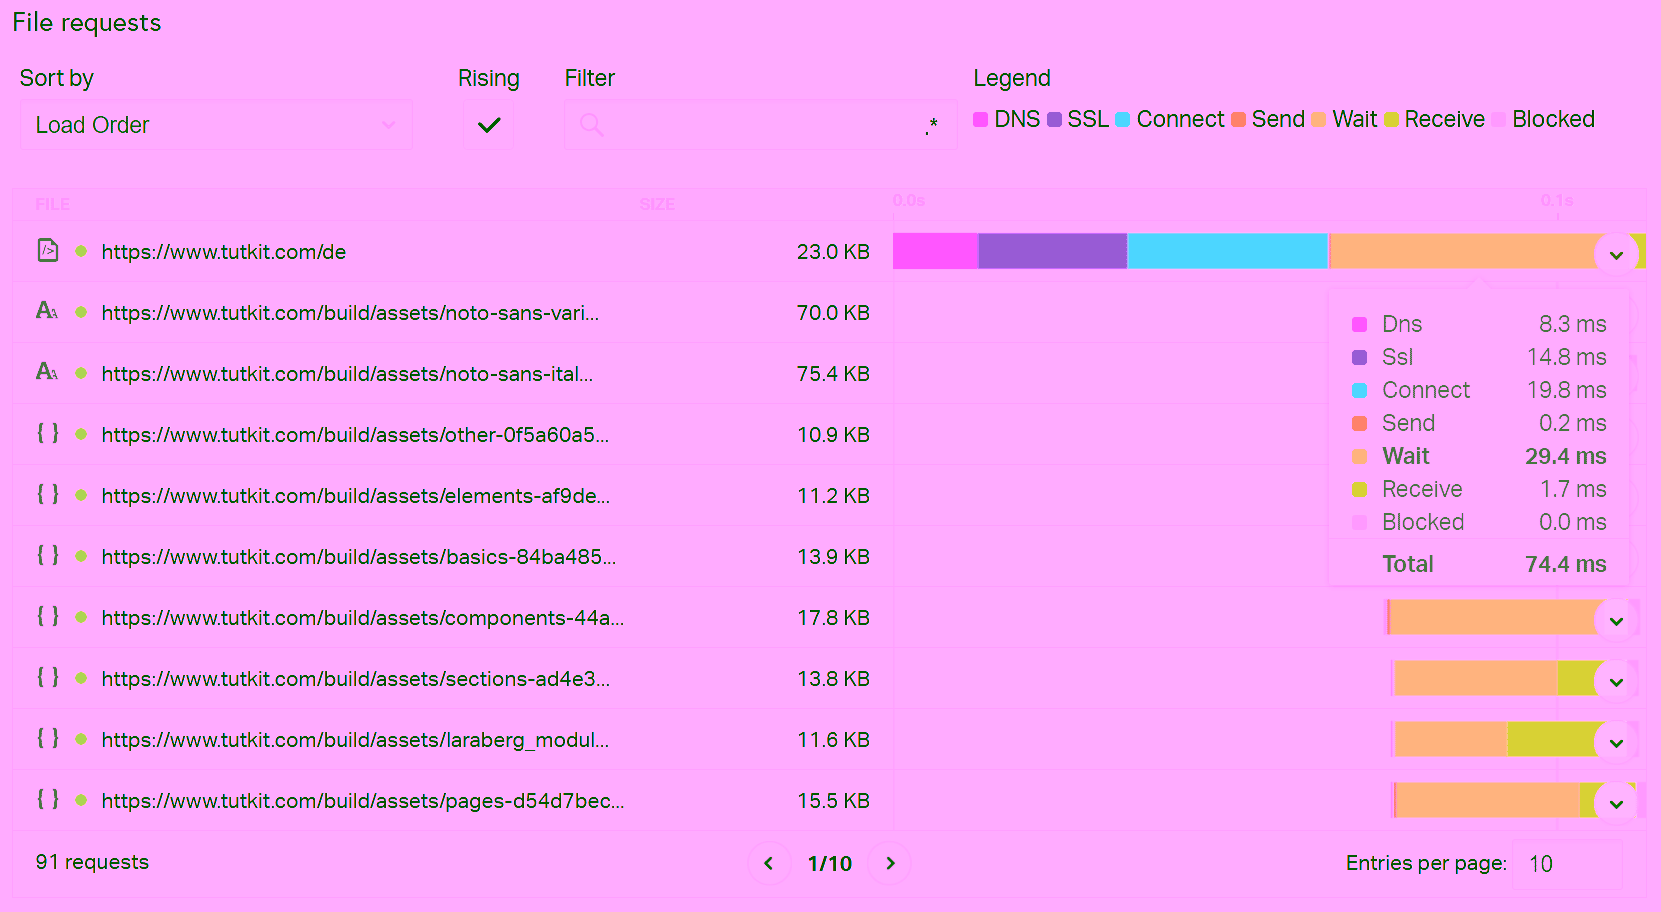
A test with Pingdom shows you the live TTFB (since with PageSpeed Insights you only see the average values of the last 28 days): The value for Wait shows 29.4 ms for us. This is the time the web browser waits for data from the server. So, the time to first byte.
DNS optimization as an additional factor
Another aspect that contributes to improving overall performance is the DNS query time. This is the time required to resolve a website’s domain into its IP address. The time for the average DNS lookup typically ranges from 20 to 120 milliseconds.
We have also analyzed the DNS times of our website and found that our DNS query time is between 6 to 11 milliseconds, which is significantly below the average of 20 to 120 ms. This shows that our DNS setup was already optimal and therefore had no negative impact on the overall speed.
Special feature in multilingual, extensive projects: Challenges for route caching
An important challenge that arose while optimizing our project is the multilingual structure of our website. Our portal is currently online in 26 languages. Each language currently has over 3,700 subpages. With each new language, additional URLs were generated, which exponentially increased the number of routes that the server has to manage.
Increasing number of routes and their impact on TTFB
In a multilingual project, each new language means that an additional URL is created in the routing table for each individual page. For example:
A page like /kontakt becomes /de/kontakt, /fr/contact, /es/contacto, and so on. With 26 languages, the number of routes multiplies accordingly, which dramatically increases the amount of data that the server has to process. As a result, without efficient caching, each additional language increases the server’s initial response time (and thus the TTFB), as the server has to search through and calculate more routes with each request. In our case, we noticed a successive deterioration in TTFB values with each newly added language, which is also evident in the upper CrUX report, where TTFB values dropped with the rollout of new languages in February and May.
Why large, multilingual projects are particularly affected:
- Exponential routing growth: Multilingual websites not only have simple static routes but also dynamic routes that depend on user interactions or API calls. When this is multiplied by our 26 languages, the routing table grows exponentially, placing more strain on the server with each request.
- Increased complexity: Multilingual projects often have more complex requirements, especially when it comes to the correct URL structure and localization. The server not only needs to find the right route but also ensure that the content is delivered in the correct language. Without caching, each request becomes slower due to this complexity.
- Increased database queries: In many cases, additional database queries need to be performed in multilingual projects to load localized content or products, for example. Route caching helps here by ensuring that these queries do not need to be executed again with every request.
If you look at large content platforms that are multilingual, you will find many websites struggling with PageSpeed in general and the TTFB value in particular. Here is an overview of websites that are content-wise similar to TutKit.com (only significantly larger in terms of the number of pages) – created using RUMVision.
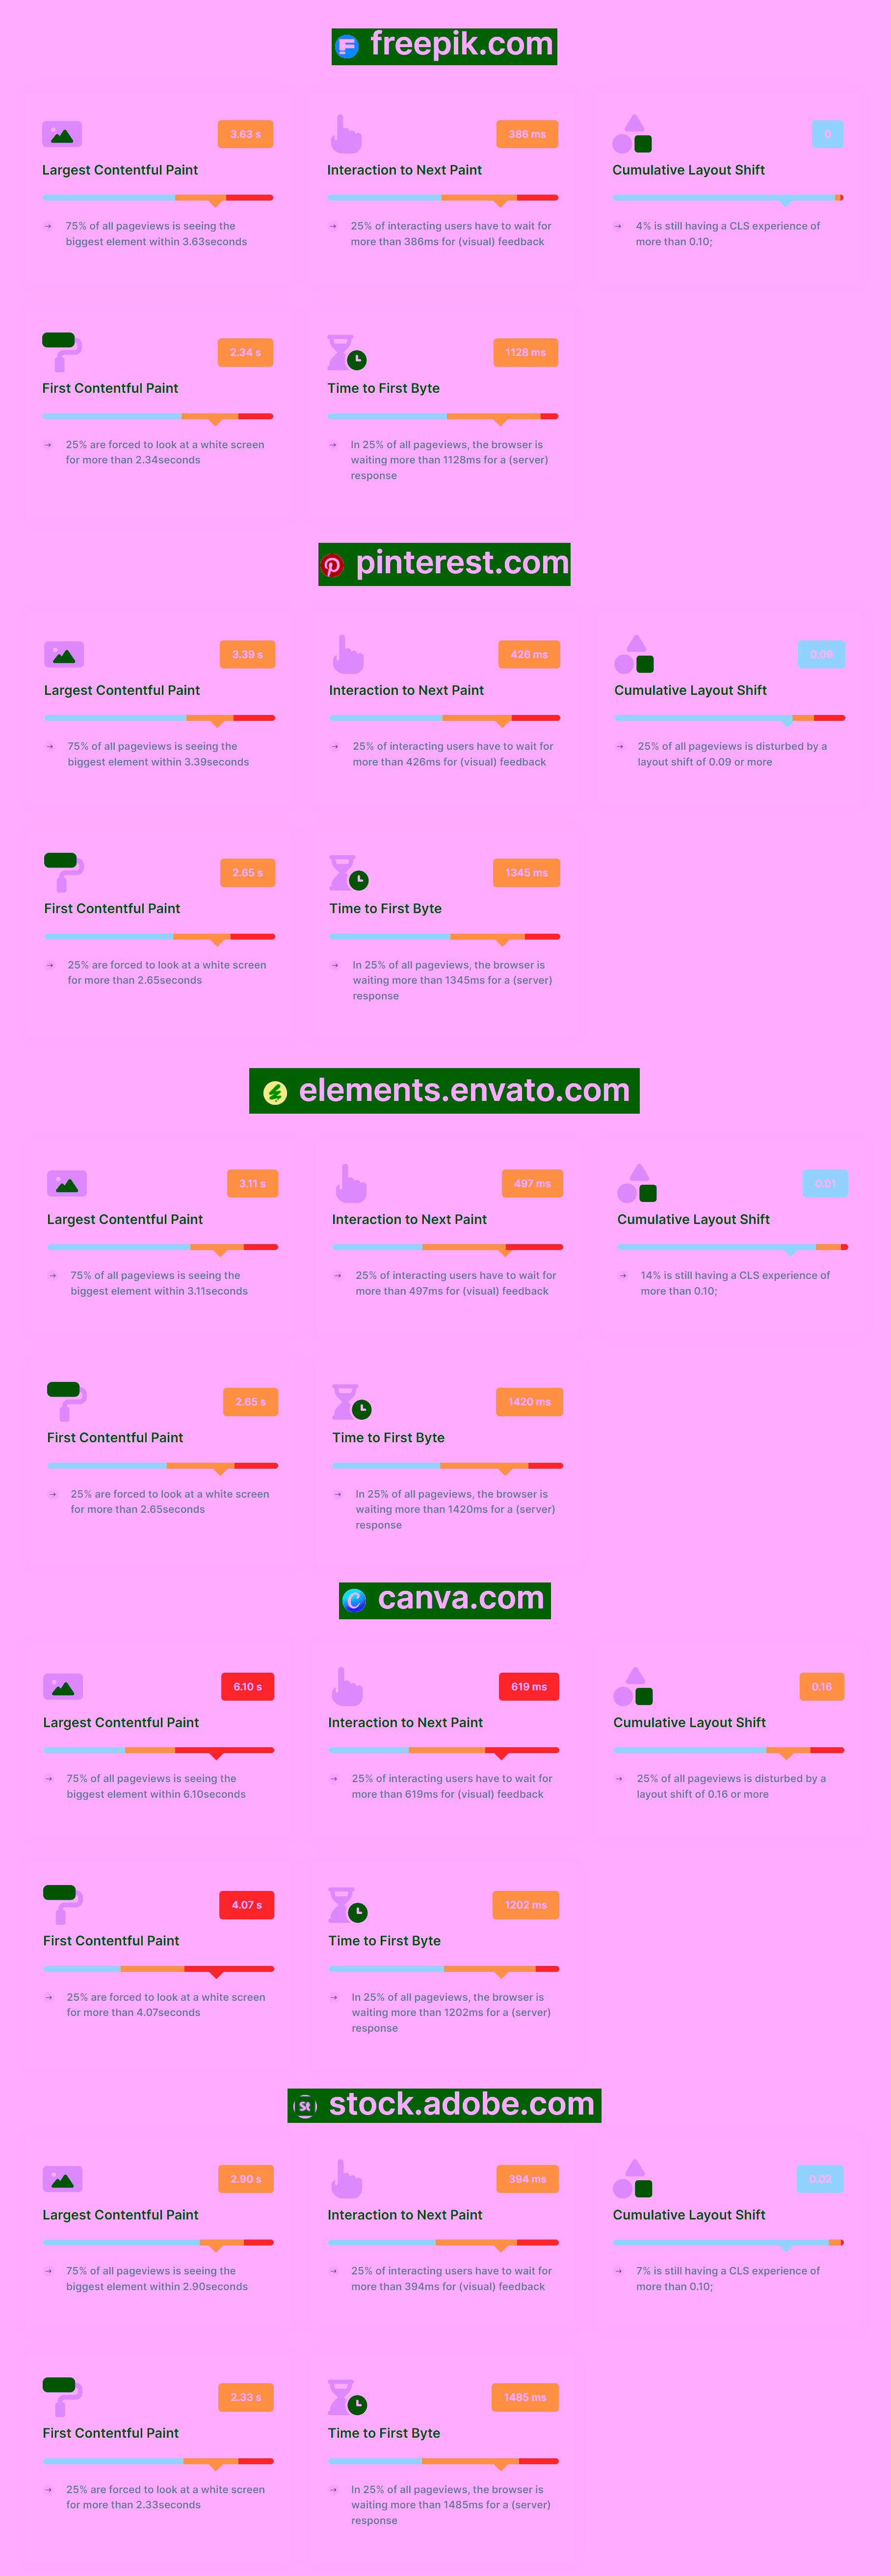
They are all well-known, highly successful services. However, they all have their problems with TTFB and other core values.
Route caching as a solution for multilingual projects
In our case, the activation of route caching was particularly crucial, as it significantly relieved the server. By caching the routes, the server was able to load all routes – regardless of the number of languages – from a fast cache instead of recalculating them every time. This led to a massive improvement in server first response times, from previously 280–700 ms to only 30–70 ms afterward.
For multilingual projects, it is essential that route caching is not only activated but also well optimized. Route caching is a well-implemented feature in Laravel, one of the most popular PHP frameworks. Laravel provides developers like us the opportunity to store all routes of an application in a single file, which can then be loaded faster, significantly improving performance, especially in large projects with many routes.
But route caching is not limited to Laravel. There are similar concepts or implementations in other CMS and PHP frameworks to optimize the efficiency of route management.
- Efficient Cache Management: The more languages and routes your project has, the more important it becomes to have an efficient caching mechanism. Regularly check the cache integrity to ensure that outdated or unnecessary routes do not unnecessarily increase the cache size.
- Correctly caching dynamic routes: Ensure that dynamic routes, which may arise from user actions or API calls, are handled correctly in the cache. Dynamic routes may require specific rules or invalidations in some cases.
- Testing cache effectiveness: Use tools like Google PageSpeed Insights or WebPageTest to check how effectively route caching is working. Especially for large, multilingual projects, regular testing is important to ensure that the cache functions as intended.
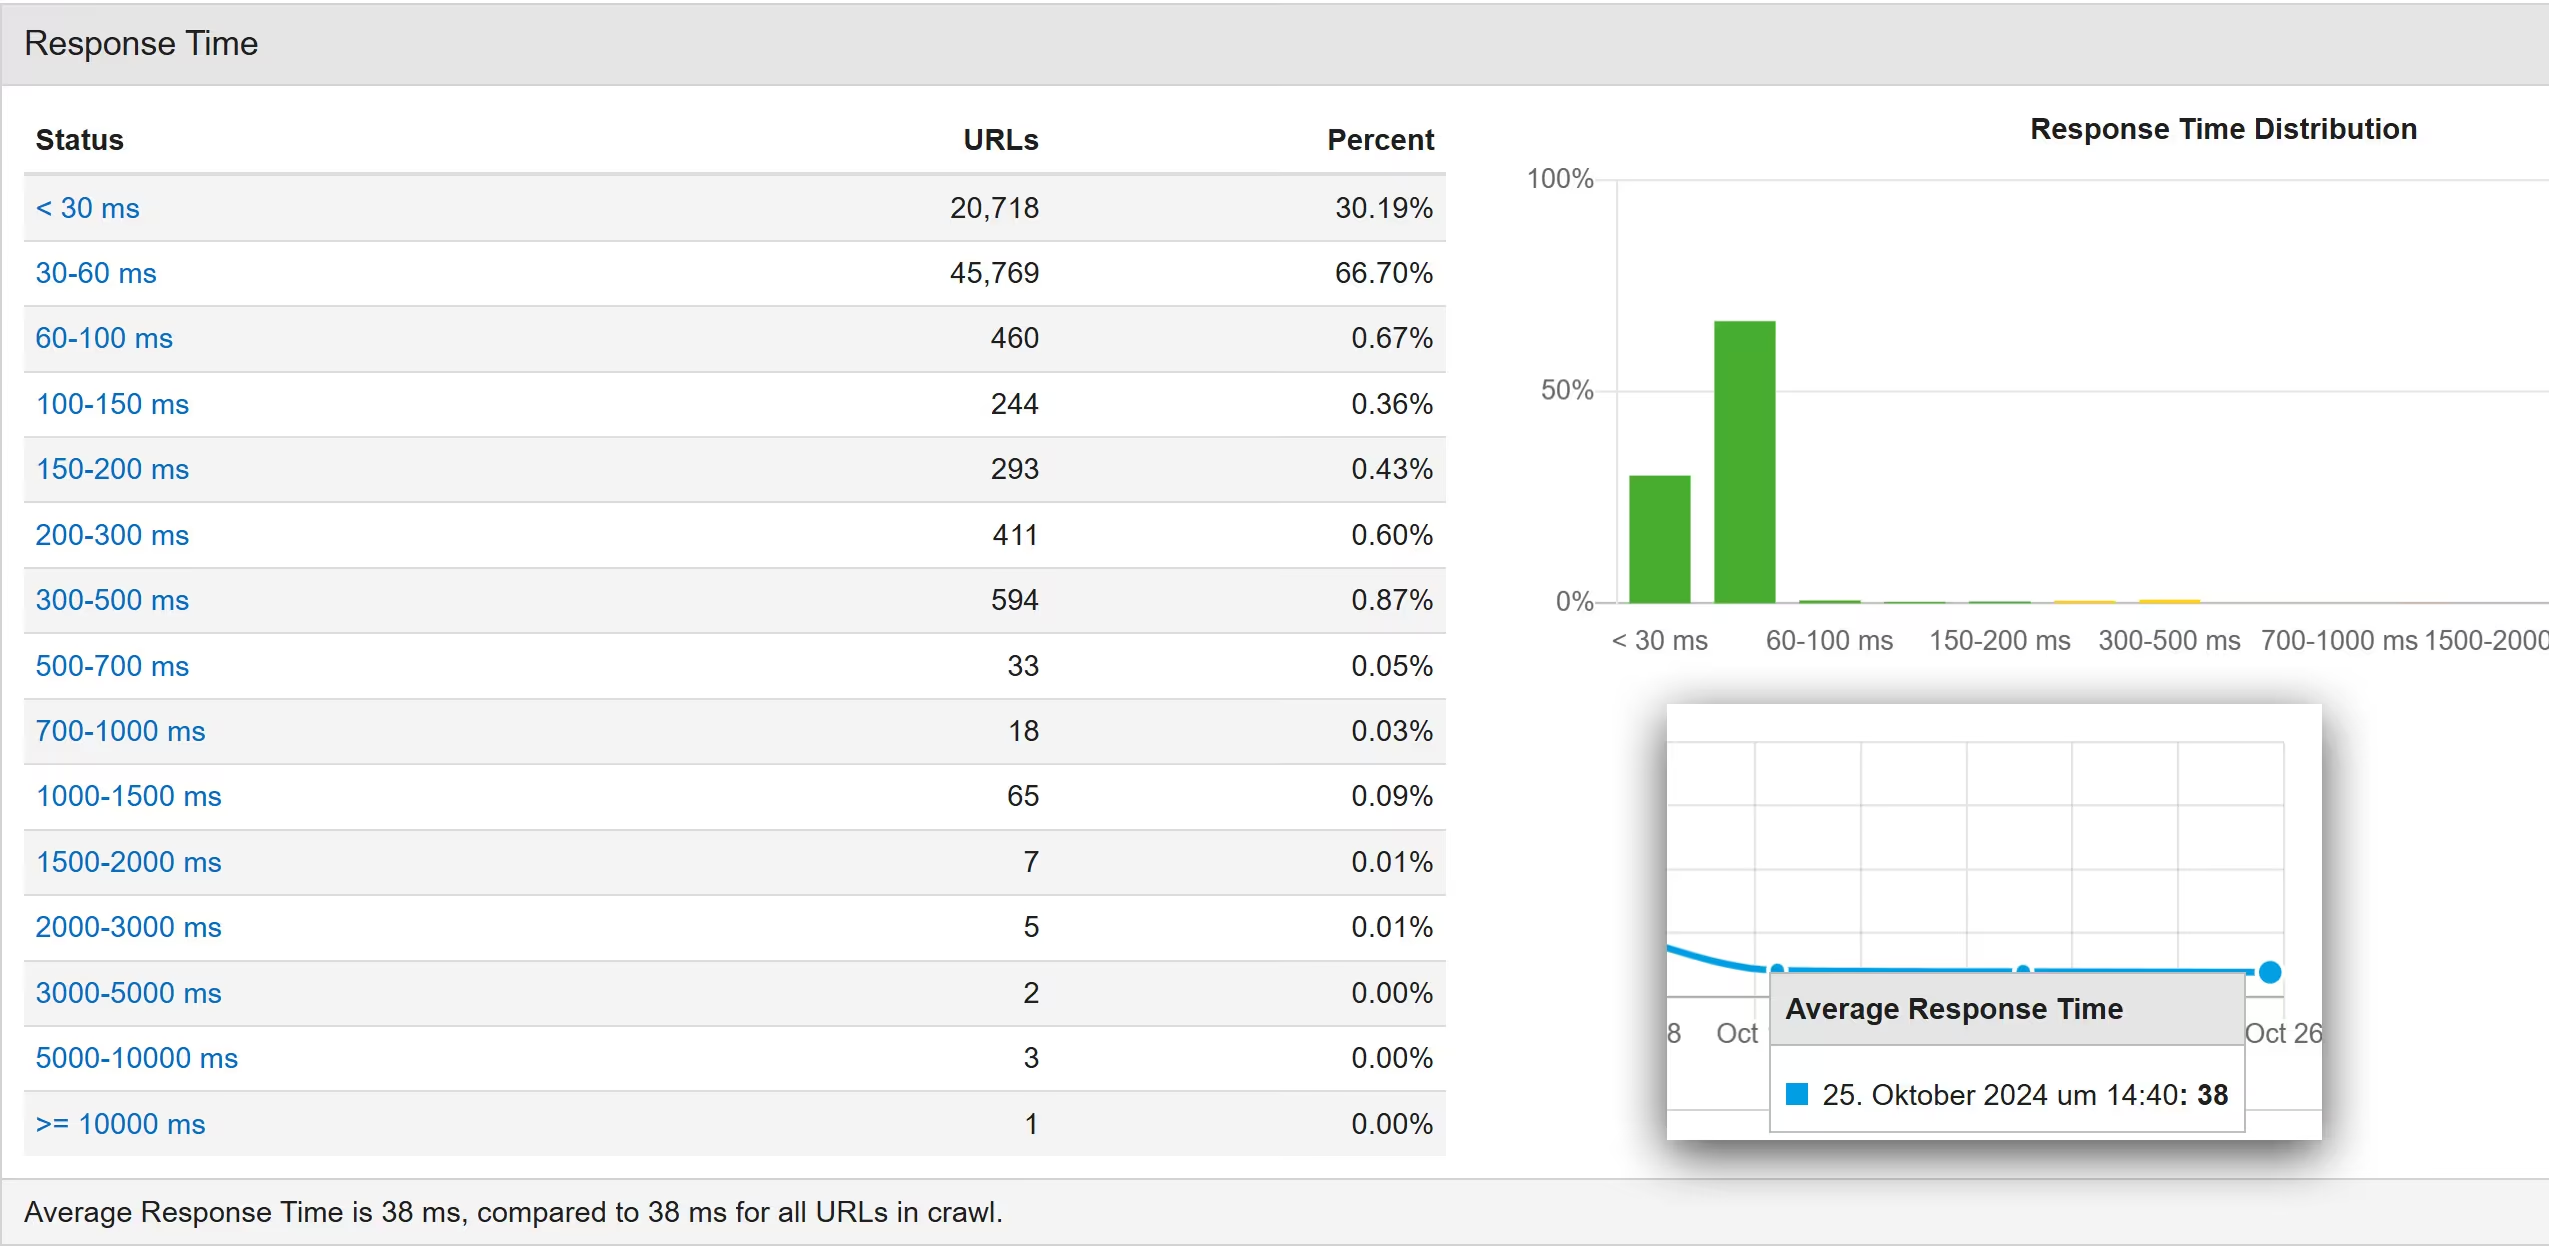
Here is the current crawl from Audisto on October 25, 2024. Our value has further improved to an average of 38 ms.
Conclusion: Caching as a Critical Factor in Multilingual Websites
For large, multilingual websites, the correct implementation of route caching is crucial to improve TTFB and overall performance. Currently, we operate in 26 languages. Our goal by mid-2025 is to have 50 languages on TutKit.com. Each new language adds more complexity and potential load on the server. Without caching, the initial response time noticeably deteriorates with each new language. By enabling and optimizing route caching, we have made a significant step towards better server initial response time. The reduction of the server initial response time from over 280 ms to about 30 ms demonstrates how effective this measure is. Additionally, the already optimized DNS query time, together with caching, has significantly increased the speed of our website.
The optimization of our caching system was key to ensuring a fast and responsive website despite the many routes and languages. Multilingual projects and content platforms therefore benefit significantly from a well-thought-out and maintained caching strategy – not only for user experience but also for SEO performance.
Update November 17, 2024: It is interesting that the improvement in server response times has also led to an increase in crawl requests, resulting in our pages being crawled and indexed by Google more quickly and more frequently.
")
Update 17.12.2024: A month later, it appears that the trend continues. Further improvements have reduced the average response time, while crawl requests have continued to increase.
")
If you are looking for performance improvements for your multilingual, highly scalable website, you should also consider checking and initializing route caching for your system. The implementation may require some debugging and optimization in some cases, but the results speak for themselves: faster loading times, better user experience, and improved SEO. If you need help, feel free to reach out to us! As a tech agency specializing in SEO and PageSpeed optimization, we are happy to assist.