Efficient database optimization & reduction of database queries
In recent months, we have focused quite a bit on efficient database optimization and reducing database queries. The background was that with the introduction of multilingualism at TutKit.com, now in 23 languages, the databases have taken on entirely new dimensions and the demands on performance and scalability have increased. Thus, we carried out a sprint for database optimization and reducing database queries with quite astonishing results.
We went through the different types of pages (category pages, product pages, blog pages, etc.) and systematically optimized and reduced the database queries. To give just two examples:
- We were able to reduce category pages from 916 to 16 queries and the server running time from 177ms to 15ms.
- We were able to reduce product page database queries from 2064 to 157 and the server running time from 412ms to 68ms.
With this, we have been able to reduce the database queries by 92 to 98%, while simultaneously achieving an enormously improved speed, which now only requires 8 to 17% of the previous time. What a result!
Here is a before-and-after comparison with the debug bar enabled for our Laravel project, using the same type of page. It was a product page that contained a lot of content:

Over 2,000 queries were already a brutal amount, I admit. I will explain why we had such high values in another blog post when it comes to working with other agencies, mediocre know-how, and technical debt. Our backend developer took on this page and was able to achieve the following result after 1.5 days of optimization:

Since this was about the page types of the products, it had a very large impact on many pages for us. These pages, in particular, should impress with high performance both in user experience and in attractiveness for Google, so that they rank higher. We are extraordinarily satisfied with the result.
Good reasons for database optimization and reducing queries
Database optimization is an essential part of software development and refactoring that offers a variety of benefits. Developers and companies managing large projects such as online shops or portals should take this practice seriously for the following reasons:
- Improved performance and speed: Optimized databases allow for faster queries and shorter loading times. This is especially important for applications with high data volumes or high user activity, as fast response times significantly enhance the user experience.
- Scalability: A well-optimized database can handle increasing amounts of data and a growing number of concurrent users better. This ensures that the application remains efficient even with rising data volume.
- Resource efficiency: By reducing unnecessary queries and improving database structure, less computing resources are required. This leads to lower operating costs and a more efficient use of the existing hardware.
- Reliability and stability: Optimizations help prevent database bottlenecks and failures. This is especially important for business-critical applications, where downtime can result in significant financial losses.
- Better user experience: Users expect fast and smooth interactions with applications. Optimized databases help ensure that users are not frustrated by slow loading times or delayed responses, which increases customer satisfaction and retention.
- Competitive advantage: In a highly competitive market, the performance of an application can be a decisive factor. Companies that invest in database optimization can stand out from the competition through superior application performance, also because Google simply loves high-performance websites.
- Error and problem reduction: By identifying and fixing inefficient queries and structures, potential sources of errors can be eliminated. This leads to a more stable application and reduces maintenance effort.
- Cost savings: Optimizations can reduce the need for additional hardware and resources, which can lead to significant cost savings in the long run. More efficient database operations also mean lower spending on cloud services and hosting.
Overall, database optimization significantly contributes to improving the performance, reliability, and scalability of applications and projects, ultimately leading to a better user experience, higher search engine rankings, and lower operating costs.
How exactly did we proceed? Here is a summary!
Debugging and Profiling Tools in Programming Languages
The work mainly involves debugging and profiling tools. Debugging and profiling tools are essential for developers to identify and fix issues as well as optimize application performance. These tools provide insights into various aspects of code execution and help developers ensure that their applications run efficiently and correctly. One of the tools we use in our Laravel project TutKit.com is Debugbar.
Important functions of debugging and profiling tools
- Query monitoring: Tools like Debugbar in Laravel log all database queries executed during a request and display details, bindings, and execution times of the queries. This helps identify slow or redundant queries that can be optimized.
- Performance profiling: These tools provide a breakdown of the execution time of a request, including the time for database operations, rendering views, and other processes. This helps to identify performance bottlenecks.
- Error and exception logging: You capture and log errors and exceptions that occur during code execution, providing detailed stack traces and error messages to help developers quickly identify and fix issues.
- Route information: For web applications, these tools often display information about the current route, including route parameters and middleware, which is useful for troubleshooting routing issues.
- View rendering: They indicate which views have been rendered and how long this took, contributing to the optimization of view execution.
General application case
In every programming language, the workflow for using a debugging and profiling tool typically includes the following steps.
- Installation and Configuration: Setting up the tool in your development environment.
- Execution monitoring: Execution of your application and use of the tool to monitor various aspects of its execution.
- Data analysis: Reviewing the logged data to identify slow queries, performance bottlenecks, and errors.
- Optimization and Debugging: Implementation of necessary changes for performance optimization and resolution of identified issues.
- Functional tests and bug fixing: After the optimization, it must be checked whether all necessary content and functions have been retained.
Example: Laravel Debugbar
In our Laravel project, we use the Debugbar to monitor and optimize our application.
- Show queries: Debugbar displays all executed queries, their execution time, and parameters.
- Identifying slow queries: We look for queries with long execution times and optimize them.
- Check the number of queries: We ensure that there are no unnecessary repeated queries that could indicate an N+1 problem.
- Performance profiling: The timeline function helps us see where execution time is spent, allowing us to optimize accordingly.
Detailed analysis of database queries and schemas
In the next step, we analyzed similar database queries, identified slow and time-consuming queries, reviewed database tables without indexes, and examined unnecessary default columns. This comprehensive analysis allowed us to significantly optimize database performance.
In-depth debugging and performance optimization in databases.
During debugging, our tool (like Debugbar) provides insights into which files and lines each query comes from. However, with over 40 files, including vendor files, identifying the cause can be challenging. Here’s how we proceed:
- Thorough debugging: We use our experience and detailed debugging to quickly locate the problem, even when it is not immediately obvious. We analyze why the problem occurred and review both the code and framework inefficiencies.
- Code and Framework Analysis: Sometimes well-written code can cause performance issues if the framework is not adequately optimized. Conversely, a good framework can suffer under poorly written code or non-compliance with programming standards.
Common Problems in Databases
The common problems in most databases are:
- Repeated requests: These can occur due to overlooked optimizations, inefficient programming practices, or unintended loops in the application logic.
- Slow queries: Often the result of missing indexes, inefficient query structures, or complex joins that can be simplified.
- Schema Design: During the project planning phase, essential elements such as indexes may be overlooked, leading to performance bottlenecks later on.
- N+1 query problem: This occurs when the application executes additional queries for related data, which could be avoided through eager loading.
- Memory leaks: Inefficient memory usage, such as not releasing resources or excessive use of global variables, can degrade performance over time.
- Competition issues: Improper handling of parallel processes can lead to race conditions, deadlocks, or other synchronization problems that affect performance.
- Network latency: Excessive or poorly managed network requests can slow down the application, especially in distributed systems.
We are confident that we can efficiently solve these problems due to our deep expertise and many years of experience. This know-how enables us to quickly identify and address issues, thus ensuring optimal performance for our projects and, gladly, yours as well.
Reduction of database queries to improve performance
The repeated querying of the database for the same data can lead to unnecessary strain and slower performance. Each call to the database consumes resources and time. Here is a sample solution:

Example of performance improvement by reducing redundant queries
The performance improvement in the updated code stems from the reduction of redundant database queries. By storing the result of the translationQuality relationship query in a variable and reusing it, the code avoids multiple database calls for the same data. This optimization reduces the number of database interactions, improving the response time and efficiency of the edit method.

Sometimes, directly querying the database with raw queries can lead to fewer and more efficient queries than using ORM methods. This approach allows for more precise control of the query and optimizations such as selective joins and filtering. By manually constructing the query, we can eliminate unnecessary overhead and ensure that only the required data is retrieved in a single, optimized query, resulting in better performance and faster execution times.

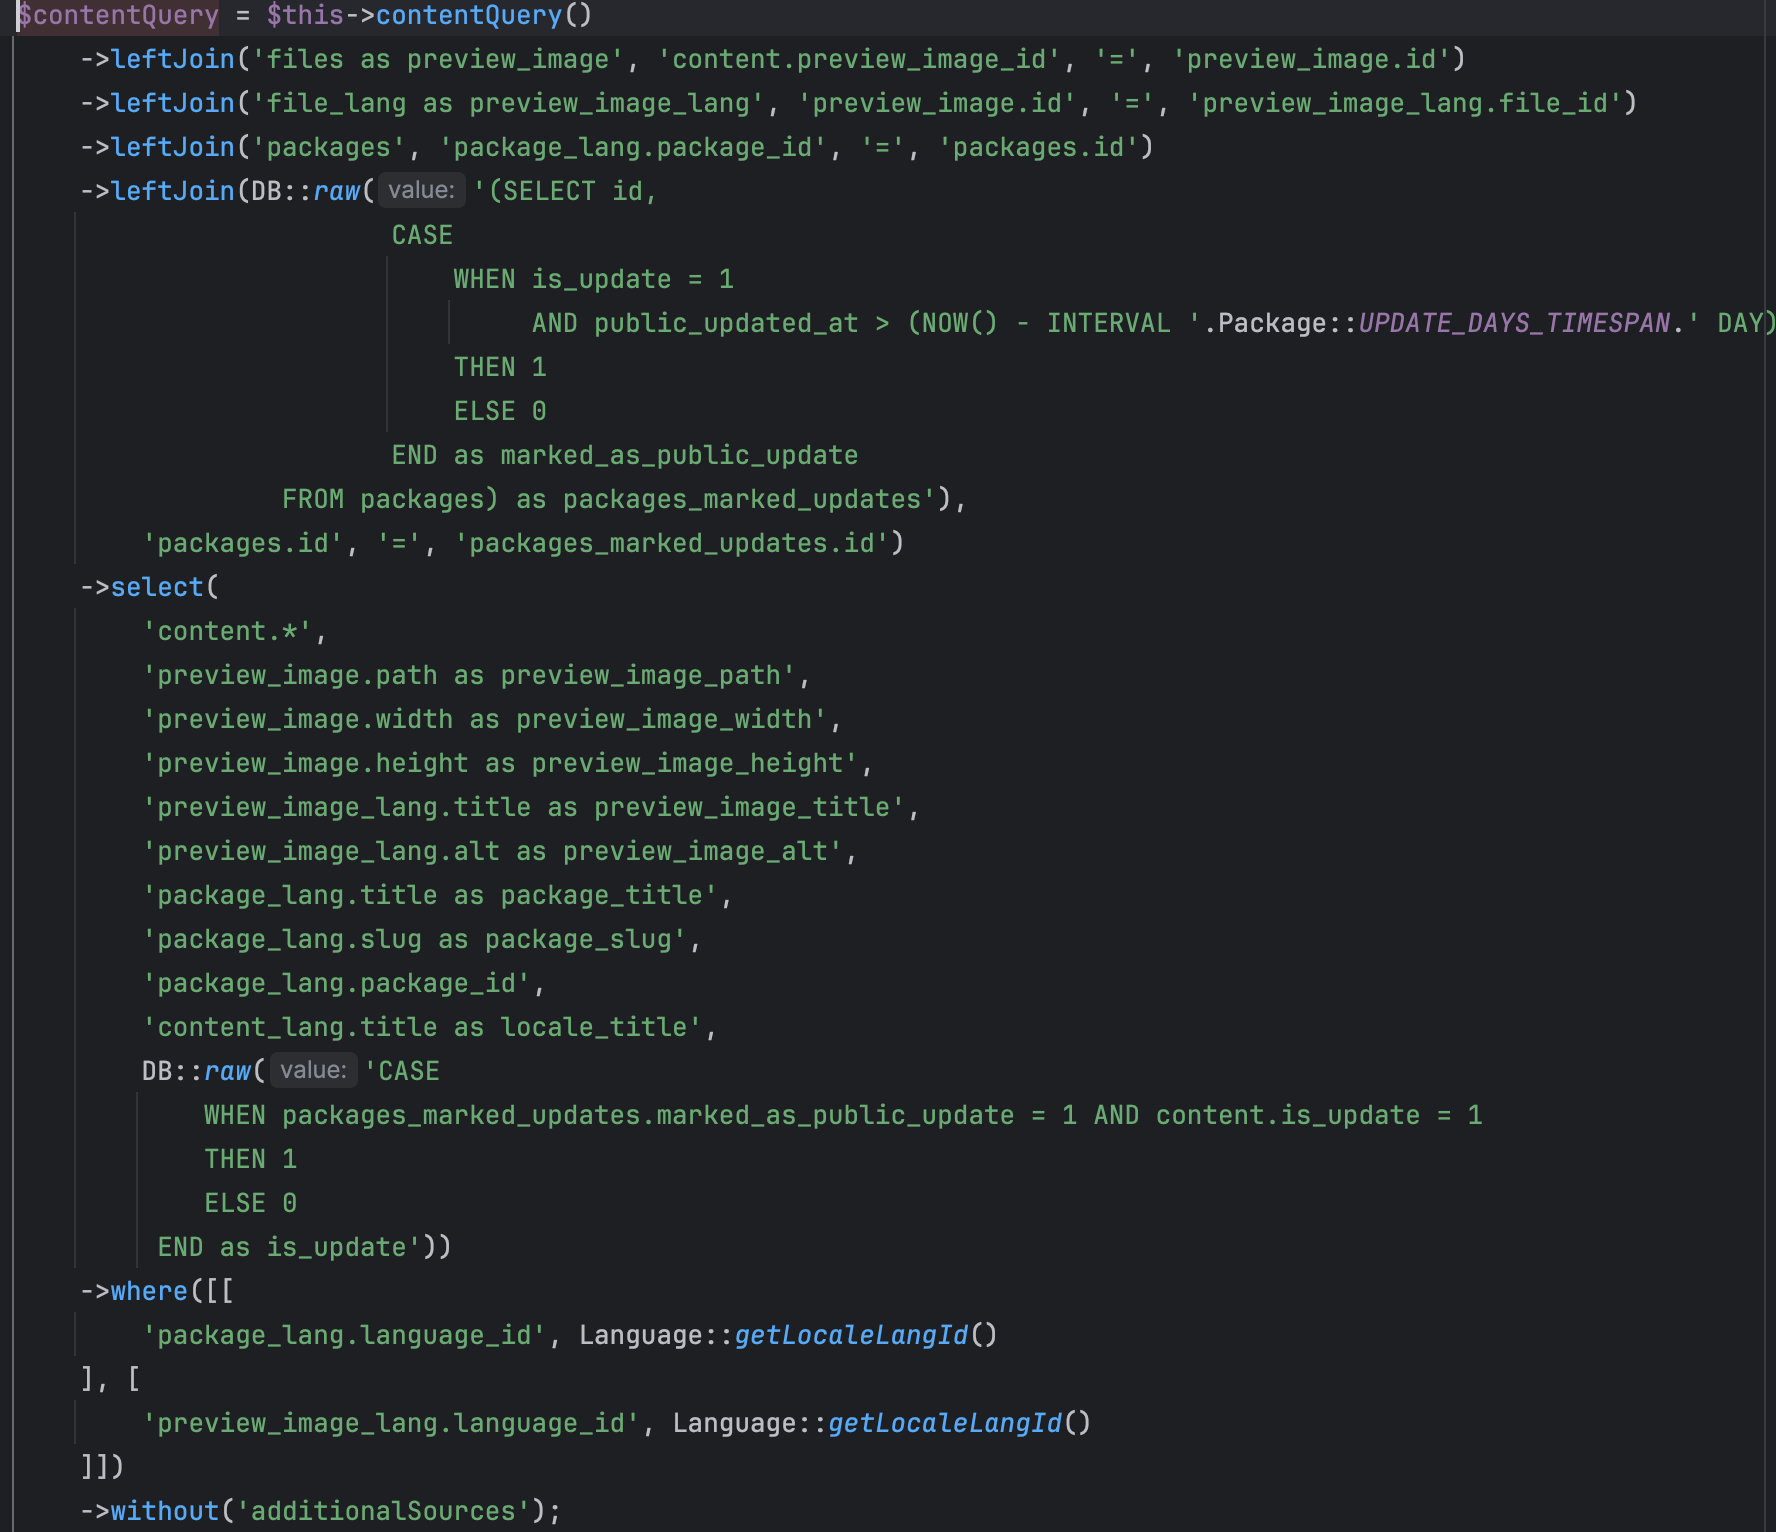
The performance update significantly improves efficiency by transforming multiple database queries into a single, optimized query. Instead of retrieving all packages and then filtering them in memory, the new approach uses a single, well-designed database join and a conditional query to fetch only the required records. This not only minimizes the amount of data transferred but also reduces the processing overhead, leading to faster execution and optimized data retrieval.

Implementation of a database index for performance enhancement
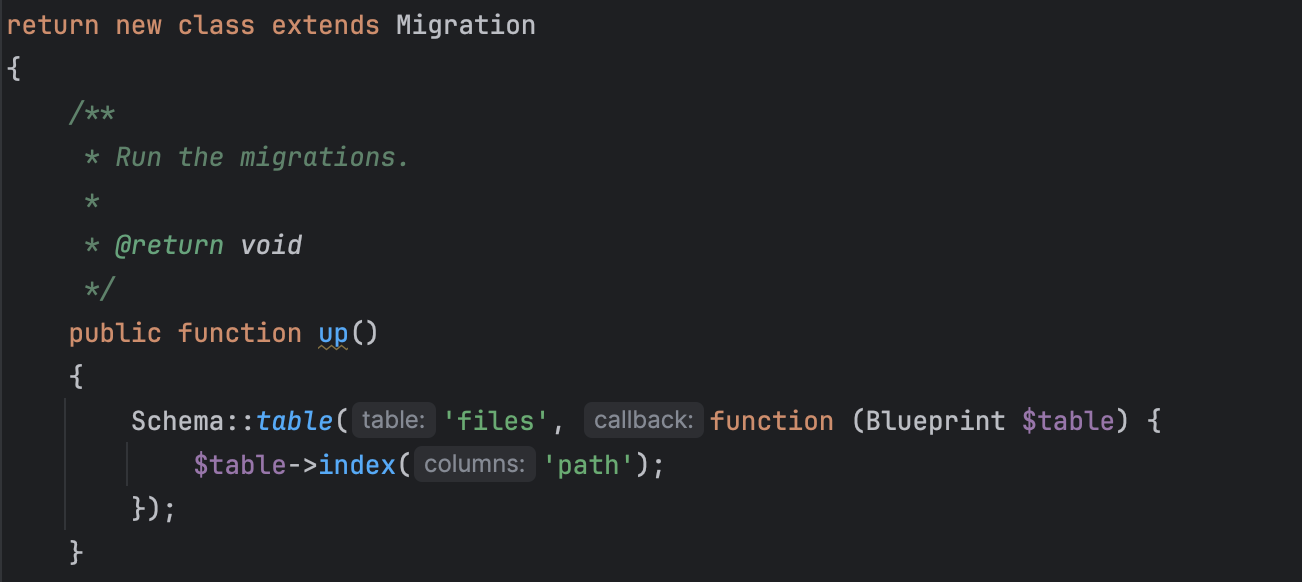
The implementation of database indexes is a powerful technique for improving page speed. An index significantly reduces the time needed to retrieve data by allowing the database index to locate and access records more efficiently. This optimization is particularly important for tables with large data volumes and frequent read operations. By indexing important columns, such as those used in WHERE clauses or JOIN operations, we can drastically reduce query execution time, leading to faster page load times and a more responsive user experience. Well-designed indexes ensure that our application can scale effectively while maintaining optimal performance, ultimately improving overall page speed.
Efficient and fast task completion
We value efficiency and speed in our workflow, which enables us to complete tasks on time. By utilizing optimized queries, minimizing redundant data processing, and applying our extensive experience, we streamline our development process. This focus on performance ensures that we deliver high-quality results in a short timeframe, meet project deadlines, and exceed our clients’ expectations.
Our expertise is not limited to a specific programming language. We apply these principles in various technologies and frameworks, adapting our approach to the requirements of each project. Whether it’s PHP, MySQL, Python, JavaScript, or another language, our commitment to efficiency and speed remains constant, allowing us to deliver exceptional performance and swift task execution in any development environment.
Calculation of the impacts of reducing database queries in sprints.
Reducing the number of database queries during a sprint can significantly improve the overall performance and efficiency of an application. To assess the impact, we first identify all database interactions in the code, with a particular focus on frequent queries and those in critical paths.
First, we measure the execution time and resource usage of the existing queries before optimization. To do this, we use profiling tools to capture the latency and load of each database interaction. By aggregating these metrics, we can establish a performance baseline.
Subsequently, we implement optimized queries and refactor the code to minimize redundant requests. This may include consolidating multiple queries into a single, more efficient query, using joins instead of separate queries, or employing caching strategies to avoid unnecessary database accesses.
After the optimization, we measure the execution time and resource usage of the refactored queries again. By comparing these post-optimization metrics with our baseline, we can quantify the improvements. Key performance indicators include reduced number of queries, shorter execution time, decreased database load, and improved response times.
Furthermore, we assess the broader impacts on application performance. This includes monitoring user experience metrics such as page load times and system responsiveness. By documenting these improvements, we provide a clear, data-driven justification for the optimization efforts.
Overall, this systematic approach to reducing database queries not only contributes to the acceleration of individual sprints but also to the long-term scalability and maintainability of the application.
Does your database need optimization?
If you have special requirements for the scalability of your project, for example, if you are planning multilingual support and international rollout or expect traffic spikes soon (e.g., due to television advertising), prepare for these upcoming loads on your databases. Especially if you feel that the initial setup of your site is already happening very slowly, your databases and database queries will not be optimal and will not be able to withstand an impending surge of many visitors on the site at the same time. This can lead to a server crash.
The easiest way is to measure yourself with a debug tool how many requests are needed for the page load. Another indication that the server response times and thus the database queries are taking too long can be found in the Search Console under Settings => Crawling Statistics. A value of over 1,100 ms average response time is almost a disaster.
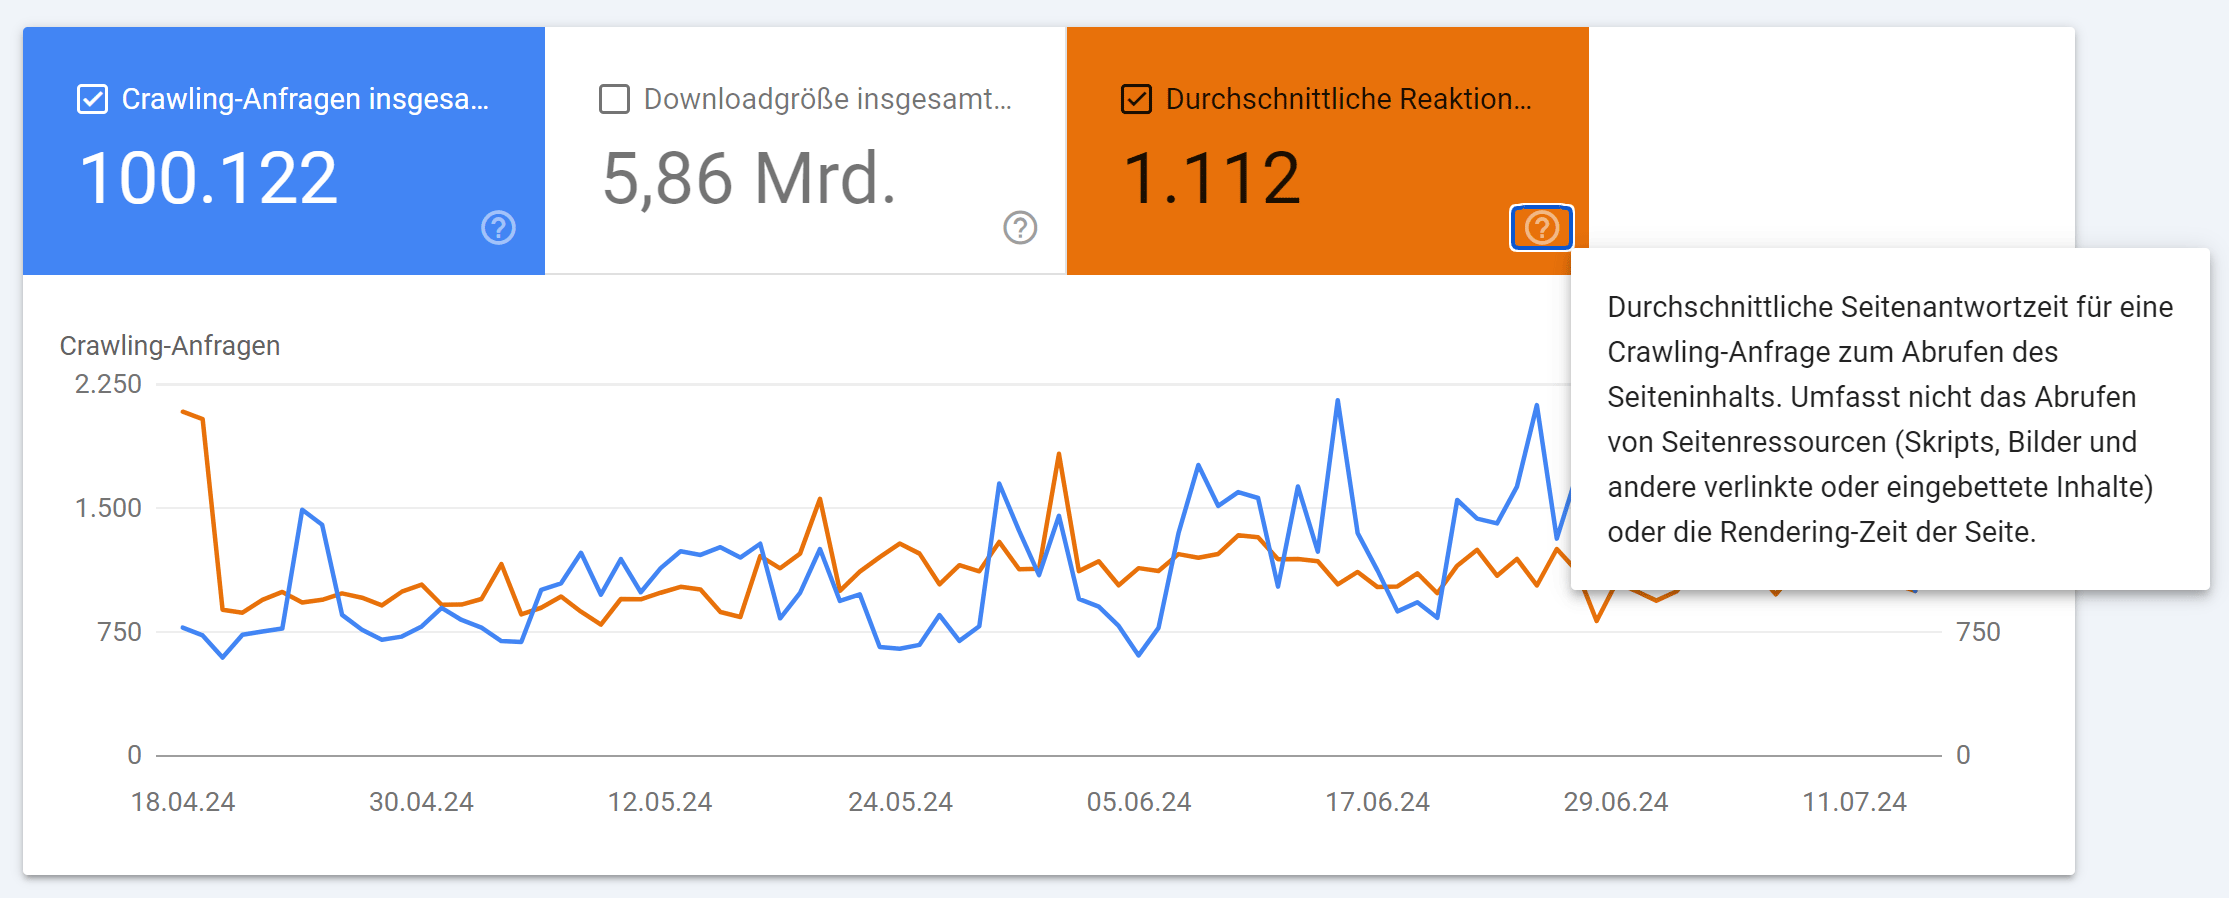
In my opinion, good values are below 400 ms. John Müller from Google recommended between 100 and 500 ms during a video call.

The best average server response time I have seen so far was 180 ms in the crawling statistics of the Search Console for an online store based on Shopify, which included texts, images, products, etc.
Agency for Database Optimization: Costs for Reducing Database Queries
We charge an hourly rate of 240 euros net for this very specialized service. We are capable of working with various database systems such as MariaDB, MongoDB, PostgreSQL, or MySQL.
The duration of database optimization per page type in your project always depends on the server and hosting as well as the framework used. Do we need to clone everything, or can we work in a prepared test environment already? Do we have SSH access or not? If everything is already set up, two full working days per page type is a good rule of thumb. If the server setup still needs to be prepared, the time will be added accordingly.
After a briefing and an initial analysis, we can provide an initial estimate of the actual time required.
If you are also interested in reducing database queries and the associated server-side performance improvement, feel free to contact us.
